West Virginia’s Office of Oil and Gas is in the process of revising and updating its 1992 Erosion and Sediment Control Field Manual which covers Best Management Practices (BMPs) for access road and well site construction. The revision is much needed and we hope industry follows it better than it did the old manual.
The BMPs are necessary for important reasons. The EPA gave the oil and gas industry an exemption from Clean Water Act rules covering stormwater discharges. Why the industry needs this exemption when every other construction industry (except mining) is covered by these regulations is beyond us. The EPA was forced to abandon part of this exemption in a strongly worded Ninth Circuit Court’s decision against the EPA. The EPA has a page devoted to the NPDES requirements of oil and gas.
These regulations are important because the issue isn’t just sediment poisoning streams and lakes, but also because of contaminated runoff from well sites. What types of contamination? Heavy metals, organics and other chemicals used in drilling and fracturing or produced by the equipment on the site. This is why bulk chemical storage on well sites during drilling and fracturing is a huge issue. There should be no possibility of chemicals contacting the ground or water during storage or by accidental spills.
Industry, in an attempt to forestall regulation, has recently created a handbook, Reasonable and Prudent Practices for Stabilization (RAPPS) of Oil and Gas Construction Sites or RAPPS (download link is on this American Petroleum Institute web page). I had been familiar with the 2004 version but was unaware until recently of the expanded and updated version released by the API and other industry associations in 2009.
The newest RAPPS depends heavily on the research by Watchal and Banks and especially on Watchal’s work with RUSLE2 modeling program. The RAPPS manual creators used RUSLE2 (in a special construction version not available yet publicly which has sediment control devices not available in the standard RUSLE2 program) to create specific BMPs for management and control of sediment at oil and gas sites.
RUSLE2 was created by the USDA Natural Resource Conservation Service (NRCS), the USDA’s Agricultural Research Service, and the University of Tennessee. The version I’ve been using I downloaded (it’s free to the public) from the USDA ARS website. Database specifics for West Virginia soils and climate were downloaded from the NRCS website for RUSLE2.
The program allows me to model soil loss based on a suite of activities. Because of a the size of a well site and the soils here, the losses are measured in many tons per acre per year. Techniques to control and manage the soil loss are able to be modeled, such as silt fences or straw mulch, to gauge the best method to control sedimentation.
Wachal’s dissertation demonstrates how modeling can be used and, with few changes, this is what the creators of the new RAPPS manual did. Watchal’s work was based on the construction of gas well pads in Denton where construction on sites with more than a 10% grade is not allowed by city regulation. Sites with low grades are also within the optimal range for RUSLE2. Sites with a more extreme grade create situations which RUSLE2 isn’t able to model or the techniques/controls aren’t available (at least on the public version I’ve been using). The RAPPS manual is best suited for these low grade slope situations.
RUSLE2 isn’t hard to learn, but the program isn’t intuitive, and user manuals are opaque. Training is usually hands-on in several-day seminars which I’m not able to take advantage of. It takes time to learn the soil science terminology and I’m thankful that RUSLE2 does all the math.
The three major inputs are location by county, soil type, and slope length and grade. The NRCS has specific county climate data and soils for download at the NRCS RUSLE2 site. The NRCS also has downloadable county soil maps and handbooks.
Starting out, I used a generic Kanawha County (Charleston area) climate location in an OSM folder in the original RUSLE2 program download (RUSLE2 is also used by the Office of Surface Mining), and inputted a generic clay loam soil with a K of 0.35 (one of the default figures used by the creators of the new RAPPS). Actually, where we live on the ridge the soil type is Gilpin/Upshur with a Gilpin horizon (brown clay with a K of 0.32) and Upshur horizon (red clay with a K of 0.43). The higher the K value, the more erosive the soil is. As I’ve been learning the program I’ve been using more specific climate and soil data.
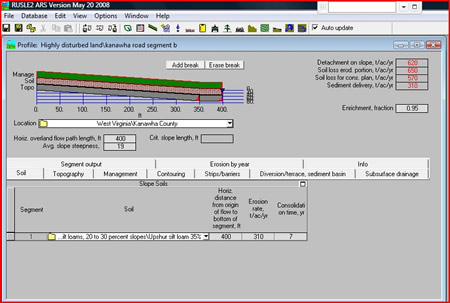
Here is a road segment profile screen shot from the program. The segment has two grade components (350 feet at 20% grade, and 50 feet at 9% grade) in our area with Upshur soil (K=0.43). The total sediment for this length is 310 tons per acre per year from a bare bulldozed surface.
We believe roads should have a cleared width of between 25 to 30 feet. For this length that makes 0.27 acre in size, or 84 tons of soil lost from graded surface. Well operators like to “daylight” roads to 50 or 60 feet width, believing that cutting back all the trees helps keep the road dry (meaning operators can be sloppy in drainage control). Daylighting is effective only minimally and not at all when the soil is cool. A 60 foot cleared road width would mean 164 tons per year lost for this road section. By being more reasonable in site clearing practices operators could cut the soil loss in half. The goal is under 5 tons per acre per year soil loss and could generally be achieved by use of mulch, gravel road surface, immediate reseeding, and sediment management devices like silt fences.
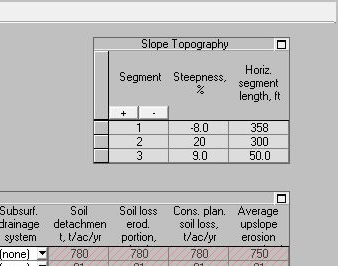
Here is a worksheet screen shot detail for the same segment. Worksheets allow
multiple management plans to be examined side by side. For this worksheet the
first row is for a bulldozed surface. The average upslope erosion figure in the
right-hand column is sediment loss and is 310 tons per acre per year. The
second row is a graded surface covered with straw mulch at two tons per acre
and with three silt fences. The sediment loss is a tenth of what it would be
without any controls. The third row is a graded surface with mulch, temporary
and then permanent seeding with 3 silt fences. The vegetated surface has a
profound effect in limiting soil loss.
This same segment could also be a hillside where a well pad would be cut in. If
the width of the disturbed surface were 300 feet for the cut, then the
disturbed area is 2.75 acres. Roads because of their length and width and well
pads because of the large area of surface disturbance on hillsides can create a
huge soil loss. Sites we’ve seen have not had mulch or seeding until after the
well is completed, sometimes more than a year later. The reports we’ve heard of
huge amounts of sediment entering ponds, streams and rivers are not at all
exaggerated.
More about RUSLE2 later. I’ve just received a copy of a special construction
version not available to the public as yet.
Risk
assessment involves categorizing and one of the side-effects of categorizing is
creating clusters or communities — those affected and those not, for instance.
Risk assessment, though, goes further and arranges communities within a hierarchical
order.
This sort of thinking makes sense in a triage situation or an emergency where
response has to be quick and effective. We believe that since there is no
public discussion about these categories or the way they are constructed, that
the process is open to a bias, no matter how “scientific” or
“objective” it may be. One of the biases built into the EPA’s (and
the state’s) process of risk assessment is the desire not to create a
remediation procedure that is too costly to industry or business. Permitting
and other functions, either on a national or on a state level, also have to be
concerned with the economic cost to industry.
We believe a bias can be shown to be present if the process is not working —
if people are getting sick or if the environment is showing degradation. That’s
already happening, isn’t it? Witness global warming. Witness the eradication of
aquatic life in 30-some miles of Dunkard Creek that wanders through West
Virginia and Pennsylvania. Witness the concerns of residents in the coal fields
of West Virginia about underground coal slurry injection and their poisoned
drinking water.
The communities we’ll be discussing in this post related to risk assessment are
the chemicals, their effects, people and the environment.
The choice of whether a chemical is to be categorized as a COPC (Chemical of
Possible Concern) is somewhat arbitrary. Again, this works great in a triage
situation. But there are chemicals that aren’t directly toxic to people, that
we believe should be members of the COPC category — chloride is one. The state
includes chloride in its water quality standards but chloride doesn’t appear on
the de minimis list of COPC for 60CSR3. Chloride also doesn’t appear in
standard EPA risk assessment tables or those produced by NOAA.
Chemicals that do appear on risk assessment tables are divided into those that
cause cancer and those that do not. Generally, those that cause cancer have
much stricter screening levels. The problem is that there are chemicals such as
endocrine disrupters that have effects on humans and wildlife that could
jeopardize a species’ survival. In addition, the presence of a chemical on a
risk assessment table generally means that there have been accepted scientific
studies about the effects of that chemical. A chemical not on the list should
not be considered safe.
In risk assessment concern is about a site’s effects on populations, not
individuals. If the community isn’t large enough, then concern lessens. We also
have the feeling that if the community isn’t important enough, then concern
lessens. This means an urban population tends to have a higher importance than
a rural population. Class and race also enter the equation.
One way that states lessen the economic effects of remediation is by having a
process where a contaminated site can be, either through deed restriction or
covenant, used only for industrial purposes. The risk assessment for industrial
soils is many times less protective than residential, and that makes sense in
some instances. The process, though, makes it easy to rubber stamp a site as
industrial and not do anything about it. In many places industrial and
residential sites are not carefully delineated — industrial sites have close
neighbors who live in houses.
The site we’re looking at is not located where its effects will be felt by a
large enough community to make it very important from an official, risk
assessment, standpoint. Only a few nearby residents could possibly directly
experience the results of soil or groundwater contamination. Again, in a triage
situation, such thinking might be appropriate (though racial and class bias
would not), but here we believe that the possible effects on individuals
warrants closer examination.
The bias that is shown for communities of people in risk assessment is
heightened when it comes to environmental screening. Ecological communities are
carefully delineated and extremely narrow and include endangered species,
old-growth forests, and federal and state parks. Our belief is that if the contamination
at a site can be assessed to cause a risk to wildlife or vegetation, then that
is a problem, even if the wildlife or vegetation doesn’t have the luxury of
being rare or located in a park. We’re especially concerned about the numerous
instances we’ve seen at well sites where deer have been attracted to areas that
have been contaminated in one way or another. Deer are attracted to salts and
minerals present but it’s possible they are also ingesting chemicals that could
do them harm, or harm those further up the food chain.
Risk assessment is a tool but the way the tool works is often wanting.